Teens and the impact of social media, a deep dive into recent work from Haidt
In my little circle of the world, the debate between Jonathan Haidt and Robby Soave on the impact of social media has been making the rounds. The overall event was fascinating, but towards the end, a statistician pushes back against Haidt in a heated way, which can be found here.
The audience member says,
I think at the heart of what you said was that anxiety in first among young girls had increased, had tripled, and the analysis you had done had showed that there was a 0.20 correlation.
Continuing the audience member says,
I’m not sure that you understand that what you were saying was that four-fifths of that tripling was due to something else and that at best one-fifth of that tripling was due to involving social media if there was causation.
In other words, a correlation of 0.2 means that the model is limited. It doesn’t explain all that much in the dependent variable. There is still a big part of the variance that remains unaccounted for.
Haidt responds in three ways. First, he notes that correlation doesn’t mean causation. Second, Haidt conceded a bit about the implications of a 0.2 correlation. Third, and most importantly, he then shifted to discussing dose-response for social media.
I think it is interesting that Haidt shifted to dose-response because that’s the important part. Correlations aren’t what we should be concerned with, but that is how Haidt leads his work. Instead, we should be interested in effect sizes. We should care about the impact of tech. We should care about oomph, not precision.
After a little digging, I found the paper that Haidt was referencing in the video with Soave. It is a team effort, co-authored by Jean M. Twenge , Jonathan Haidt, Thomas E. Joiner, and W. Keith Campbell, titled “Underestimating digital media harm.”
As I started reading, I was quickly pulled back.
The Haidt paper was yet another piece that this group had written in reaction to parallel work from researchers in the United Kingdom, Amy Orben and Andy Przybylski. I’ve written about work from Orben and Przybylski before. There is a long history between these two groups, and I tend to be more persuaded by the work of Orben and Przybylski rather than by the arguments of Twenge and Haidt.
To understand what Haidt is arguing, you need to know a bit of the backstory, which I have tried to lay out below. But to understand the importance of what is being said, it is important to know a bit of theory.
Interlude: Oomph, not precision
A couple of years ago while moving I found a little green notebook and opened the cover. On the first page was a simple phrase: oomph and precision.
Memories flooded back.
As a grad student at the University of Illinois at Chicago, I got the chance to study under Deidre McCloskey. I used to keep a notebook around to write down her suggestions and references and citations. Small phrases would turn into deep research later.
Oomph and precision is her way of teaching a key lesson in statistics. All of this is detailed in her work with Stephen T. Ziliak, titled “The Cult of Statistical Significance."
Think about your own mother,
Suppose you get a call from your Mother, who wants to lose weight. Your Mom is enlisting you—a rational statistician, educator and Web surfer—to find and choose a weight-loss pill. Let’s say you do the research and after ranking the various alternatives you deign to propose two diet pills. Mom will choose just one of them. The two pills come at identical prices and side effects (dry mouth, nausea, et cetera) but they differ in weight loss-ability and precision.
You find two kinds of pills for sale, Oomph and Precision,
The first pill, called “Oomph,” will shed from Mom an average of 20 pounds. Fantastic! But Oomph is very uncertain in its effects—at plus or minus 10 pounds (you can if you wish take “plus or minus X-pounds” as a heuristic device to signify in general the amount of “standard error” or deviation around an estimated mean or other coefficient).
However,
The other pill you found, pill “Precision,” will take 5 pounds off Mom on average but it is very precise—at plus or minus 0.5 pounds. Precision is the same as Oomph in price and side effects but Precision is much more certain in its effects.
So what do you choose?
All right, then, once more: which pill for Mother? Recall: the pills are identical in every other way. “Well,” say our significance testing colleagues, “the pill with the highest signal to noise ratio is Precision. Precision is what scientists want and what the people, such as your mother, need. So, of course, choose Precision.”
But Precision—precision commonly defined as a large t-statistic or small p-value on a coefficient—is obviously the wrong choice. Wrong for Mother’s weight-loss plan and wrong for the many other victims of the sizeless scientist.
In the traditional method of hypothesis testing, Precision would have been selected. It provides a more precise estimate around a tighter bound of confidence. But it would have been a wrong choice when we wanted the largest impact.
Think about it,
Mom wants to lose weight, not gain precision. Mom cares about the spread around her waist. She cares little—for example, not at all—about the spread around the average of a hypothetically infinitely repeated random sample.
For tech use, want to know the oomph. We want to know its impact. The language of economics isn’t all that different than psychologists. Psychologists care about oomph, they just call it the dose-response. Economists care about oomph and they call it effect sizes.
It is a long wind up to the point, the reason why I looked askance when I first encountered Haidt’s response on video. When pressed about the topic, Haidt switched from correlation (precision) to dope-response (oomph). His instincts were right. We should care about the impact of tech.
The windup: The history of the debate
The paper that Haidt references in the video is itself a response to work from researchers Amy Orben and Andy Przybylski. I wrote about the Orben and Przybylski paper when it came out because of its scope and the methods it was using.
As I explained back in 2019,
The problem that Orden and Przybylski tackle is endemic one in social science. Sussing out the causal relationship between two variables will always be confounded by other related variables in the dataset. So how do you choose the right combination of variables to test?
An analytical approach first developed by Simonsohn, Simmons and Nelson outlines a method for solving this problem. As Orben and Przybylski wrote, “Instead of reporting a handful of analyses in their paper, (researchers) report all results of all theoretically defensible analyses.” The result is a range of possible coefficients, which can then be plotted along a curve, a specification curve. Below is the specification curve from one of the datasets that Orben and Przybylski analyzed.
They explained why their method is important to policymakers:
Although statistical significance is often used as an indicator that findings are practically significant, the paper moves beyond this surrogate to put its findings in a real-world context. In one dataset, for example, the negative effect of wearing glasses on adolescent well-being is significantly higher than that of social media use. Yet policymakers are currently not contemplating pumping billions into interventions that aim to decrease the use of glasses.
The analysis from Orben and Przybylski (2019), which continues with a follow-up paper (2021) should be considered the starting point for discussions of teens and tech use. The technique they employ runs a massive number of model combinations to test the entire space of possibilities. In total, they ended up testing 20,004 different models. It is only with the rise of cheap computing power in recent years that these massive datasets could be run. But testing all of those models means that you can combine them all into an estimated effect, an oomph.
These kinds of methods are powerful, garnering inclusion in a recent paper titled, “What are the most important statistical ideas of the past 50 years?” I hope that social scientists embrace these methods because they can be a key source of understanding the total impact of a topic. It is a method of calculating the total amount of oomph.
Once you go through each of the different surveys that track mental health for teens, it seems that tech use does have a negative impact. But in some cases, the impact is effectively zero and in others, it is as big as marijuana use. There are three surveys, The Youth Risk Behavior Surveillance System (YRBSS), Monitoring the Future: A Continuing Study of the Lifestyles and Values of Youth (MTF), and The Millennium Cohort Study (MCS). It is helpful here to look at each of the surveys and see the impact of tech use in relation to other activities, which is done in the chart below.
The three surveys show vastly different impacts. In the Monitoring the Future survey, tech use seems to have basically zero impact on well-being (-.006). For the Youth Risk Behavior Surveillance System, tech use has the same impact (−0.049) as being overweight (−0.050) or eating potatoes (−0.042). Finally, the Millennium Cohort Study (MCS) shows the biggest impact of tech use on mental health (−0.042) putting it into the range of being arrested (−0.041), binge-drinking (−0.043), smoking marijuana (−0.048), and interestingly enough wearing glasses (−0.061).
In other words, for one survey tech use has basically no impact and for the survey showing the greatest impact, tech use is about equal to wearing glasses. None of these measures give me confidence that any of the surveys are picking up what they should when it comes to tech use. Indeed, all of the researchers agree that most of the studies used for this kind of research probably aren’t the best tools to track mental health effects.
To really see how this plays out, I have combined all of the measures in the graph below.
Again, I think we should be left with the sense that these surveys are all over the place. Still though, Haidt and his co-authors are unconvinced, which is why they wrote the paper.
The paper - “Underestimating digital media harm”
So back to the video and the original Haidt paper, titled, “Underestimating digital media harm.” It is a team effort, co-authored by Jean M. Twenge , Jonathan Haidt, Thomas E. Joiner, and W. Keith Campbell.
It opens, “Orben and Przybylski use a new and advanced statistical technique to run tens of thousands of analyses across three large datasets. The authors conclude that the association of screen time with wellbeing is negative but ‘too small to warrant policy change.'”
While agreeing that it is an advance for science, Haidt and his colleagues offer six responses to the paper.
The first worry that they express is about the relationship between more screen time and more depressive symptoms. They write, “Associations between digital media use and well-being are often non-monotonic; in fact, Przybylski himself named this the Goldilocks hypothesis. Associations often follow a J-shaped curve (see Extended Data Fig. 1).”
Fig 1 is a dose-response chart included in the paper.
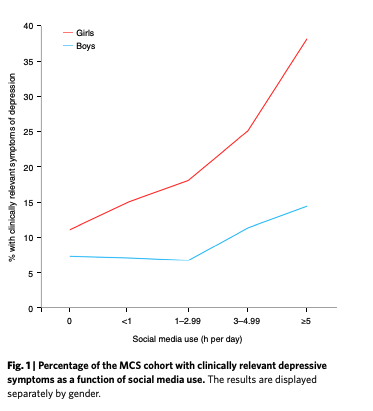
Just to be clear, monotonicity means that the function didn’t decrease at some point throughout the graph. (In technical parlance, its first derivative isn’t negative at any point.) A J-shaped curve has a slope change, which means it is not a monotonic function. There is a bend at the front of the curve that gives the J-shape its form and it is this kind of curve that makes a function non-monotonic.
So if social media effects were non-monotonic, if they were J-shaped, then the dose-response would turn back down at some point only to then rise. In other words, the bad effects would first decrease, to a low point, and then increase over more usage. See this post for more.
The paper doesn’t linger on this point long, but it is important. There is a difference between boys and girls in the data that Haidt and his coauthors present. Boys seem to display a J-shape response curve when it comes to social media. Too little time on social media is actually indicative of more depressive symptoms. There is a sweet spot of technology use for boys right around 3 hours.
Teen girls, on the other hand, seem to have steadily increasing depressive symptoms as they increase their time on tech. The dose-response curve isn’t J-shaped. It starts to increase slowly, then around 3 hours, the rate of increases rise until more than 5 hours when it rockets up. But that also means that regardless of their technology use, girls will tend to have higher levels of depressive symptoms.
It is out of the scope of this post, but most of the literature points to the same concern. There is something happening with teen girls that needs more understanding. Indeed, the second concern laid out in the Haidt response is about the “aggregation of data across screen time types and gender.” They continue, “The mental health crisis among adolescents that began after 2012 is hitting girls far harder than boys, in multiple countries. Thus, it is vital that researchers pay special attention to girls, and to the types of media that became more popular after 2012.”
Haidt and his colleagues also take Orben and Przybylski to task for the construction of the scales. “Orben and Przybylski’s effect sizes include many individual items, which are lower in internal reliability than multiple-item scales and thus produce lower effect sizes. In addition, scales with more items count more heavily in the analysis—not because they are more important, but because of the arbitrary fact of having more items.” In a follow-up post, Orben and Przybylski tested this and found little change.
Breaking down Haidt’s big number
The fourth worry presented by Haidt and his colleagues is where we find the 0.2 correlation. As they explain it, one of the key datasets used by Orben and Przybylski measures digital media use in two ways. One of them is on a scale of ‘never’ to ‘almost every day,’ and the other asks teens about their use in hours per week. It is this second measure that is the better one, but it is the first measure that Orben and Przybylski rely upon.
They make their case by charting out all of the linear r values “between well-being and various factors in boys and girls from two datasets.” The chart is pasted below.
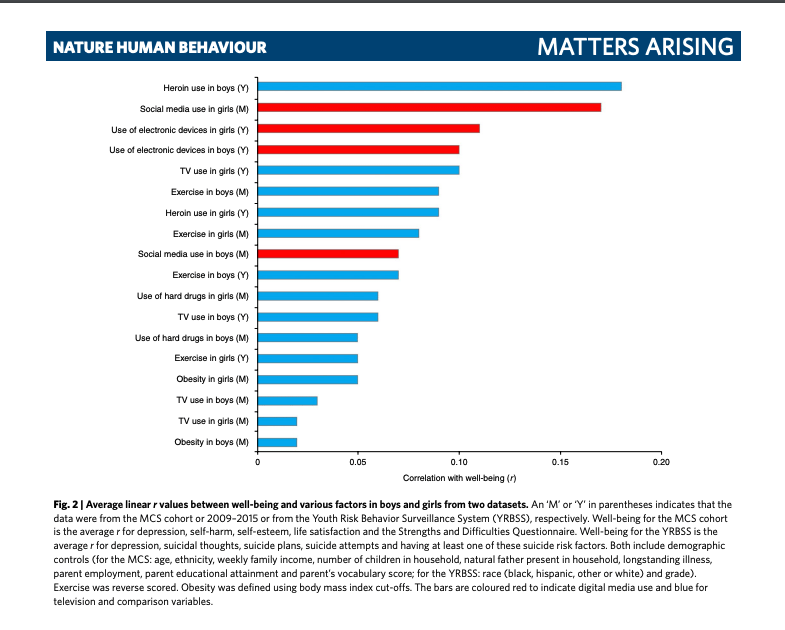
It has taken a while to get here, but it is unclear to me why Haidt is using this 0.2 correlation as his big number and the one he uses in his speeches. I could be missing some other work that explains this more fully, but it remains a head-scratcher. It is an exceptionally odd choice and not the right one for tech use because it is a measure of precision, not oomph.
The r value, more formally known as the Pearson correlation coefficient, calculates a measure of a linear association between two variables. An r of 1 means there is a perfect positive correlation an r of -1 means a perfect negative correlation. R values are useful when trying to put all of your variables on the same scale because they only range from -1 to 1.
But the equation that forces your two variables into the same scale imposes serious constraints. The most important constraint for this paper is that the association needs to be linear. J-shaped curves violate this assumption, which make them not suited for use at a minimum.
Indeed, it is fairly clear that the authors in fact didn’t run Pearson correlation coefficients. They say very explicitly that they controlled for a number of demographic factors. If that is the case, then they are running basic regression models and then reporting those results. Without getting too technical, they are telling us the beta values not the r values.
To take the first example, heroin use in boys, the measure included in that chart seems to be an average of five models. To get that measure, five regressions were probably run. The controls are laid out in the chart and εᵢ is just the typical error term. I know it looks odd, but the subscript i or ᵢ is just a way for us to say that there were a number of data crunched. It is a demarcation of all of the survey responses from each teen.
Thus, the five models are,
- depressionᵢ = heorin useᵢ + [controls]ᵢ + εᵢ
- suicidal thoughtsᵢ = heorin useᵢ + [controls]ᵢ + εᵢ
- suicide plansᵢ = heorin useᵢ + [controls]ᵢ + εᵢ
- suicide attemptsᵢ = heorin useᵢ + [controls]ᵢ + εᵢ
- at least one suicide risk factorᵢ = heorin useᵢ + [controls]ᵢ + εᵢ
Typically, these kinds of single-variable regressions are considered a first crack at the data. You run them as a way to get at sensitivities. In the context of their fourth criticism, this makes a lot of sense why Haidt would include them. The authors wanted to explore the two different survey measurements and see how sensitive they are.
As a practical matter, then, these measurements are effectively estimates of precision, not measurements of oomph. If you wanted to actually get at their impact, you would build a large model with everything included. Basically, it would take the form
- depressionᵢ = heorin useᵢ + social media useᵢ + TV useᵢ + exerciseᵢ + hard drug useᵢ + obesityᵢ + [controls]ᵢ + εᵢ
And then you would run that same equation with the other survey measurements like suicidal thoughts, suicide plans, and suicide attempts on the left hand side of the equation.
Next you would want to vary your equation a bit to see if exclusion changes anything, so the equation above would take out heroin use and become
- depressionᵢ = social media useᵢ + TV useᵢ + exerciseᵢ + hard drug useᵢ + obesityᵢ + [controls]ᵢ + εᵢ
In a massive survey with countless questions, you could vary these equations constantly and then rerun them to see the overall impact of tech use. But that is what Orben and Przybylski did. They reran 20,000 model variations.
Without being too critical, I find the final two objections laid out by Haidt and his colleagues to be offbase. They effectively claim that precision measures are actually measures of oomph, which they are emphatically not.
Where we stand now
This entire episode just reiterated how little we know about the impact of tech use on teens. I probably shouldn’t have waited until the very end to explain this, but there is a cherry on top of this incomplete pie.
Most social media research relies on self-reporting methods, which are systematically biased and often unreliable. Communication professor Michael Scharkow, for example, compared self-reports of Internet use with the computer log files, which show everything that a computer has done and when, and found that “survey data are only moderately correlated with log file data.”
A quartet of psychology professors in the UK discovered that self-reported smartphone use and social media addiction scales face similar problems in that they don’t correctly capture reality. Patrick Markey, Professor and Director of the IR Laboratory at Villanova University, summarized the work, “the fear of smartphones and social media was built on a castle made of sand.”
Few of the measures of social media use are reliable, including all of the reports analyzed above. That being said, there is something going on with young women and social media. Boys in their teenage years don’t have the same issues that girls do.
Still, I would also challenge everyone in this space to subject themselves to the Correlational Causal Turing test. As Josh Dean, Assistant Professor of Behavioral Science and Economics at Chicago Booth noted on Twitter, “If you’re not willing to flip the order of your association (e.g. Heart Attacks predict consuming avocados), you’re making an implicitly causal claim and should either knock it off or be up front about it.”
Since Haidt isn’t making a causal claim, he should be willing to flip the association. In that case, then depression might be causing tech use.
We need to take this other relationship seriously. Stephanie Doupnik, a pediatrician at the Children’s Hospital of Philadelphia explained, “People often ask me how social media and the internet contribute to teenagers’ risk of suicide. The teens we spoke with rarely discussed them alone as a trigger for their suicidal thoughts. However, for already vulnerable adolescents, technology can provide a forum for more trauma, worsening conflict or isolation. Further, having easy access to information on the internet about how to engage in self-harm can be dangerous for teens with mental health concerns.”
The effects of social media are highly personal. It deserves nuance. It seems that social media can exacerbate our faults, they can make some things worse, but these tools are not their prime cause.
The question isn’t what now, it’s what next. Rightly there is criticism about technology companies, and yet, people everywhere are incapable of resisting? I am not convinced of this.
Parents and adults need to take responsibility, some kids will need to be told no and everyone needs a dose of humility. If a teen-aged girl is made worse by social media, parents need to intervene.
In an appearance on C-SPAN about a year ago I stressed that, “The moment we are in right now is the messy moment of digital adolescence. We are all trying to understand what this new world looks like and how to integrate these new technologies in our lives.”
Haidt already wrote a small set of rules that family should adopt. We need more. We need a detente with tech. We need to talk about what tech empowerment must entail and the rules of the road. Disconnection needs to be an option that is exercised by people and families.
No one has gotten it figured out. Maturity means that we should be ok with muddling it through. It is not a satisfying answer, I know, and it is also not a complete one as of yet, but I know it is the right path to be on.
More later.
Extra resources
- “Statistical tests, P values, confidence intervals, and power: a guide to misinterpretations.” (link) Luke Stein’s Stanford graduate economics core. Always start here. It’s 65 pages of clean stats review.
- “People often ask me how social media and the internet contribute to teenagers’ risk of suicide. The teens we spoke with rarely discussed them alone as a trigger for their suicidal thoughts. However, for already vulnerable adolescents, technology can provide a forum for more trauma, worsening conflict or isolation. Further, having easy access to information on the internet about how to engage in self-harm can be dangerous for teens with mental health concerns.” (link)
- Jonathan Haidt and Jean Twenge put together a useful Google Doc summarising the available evidence.
- To read the back and forth, start with Orben and Przybylski (2019), then this piece from Twenge, Haidt, et. al (2020) then Orben and Przybylski (2020).
- https://www.nature.com/articles/s41390-022-01952-w
First published May 5, 2022